How we started – the need for more direct feedback
Early in 2012 we (some ScrumMasters, team leads and other IT managers of Germany’s top real estate portal ImmobilenScout24) found value in the idea to have something like a continuous employee happiness feedback.
By the time we already had 500+ employees and we were making use of several annual employee feedback surveys. Those surveys gave us good insights into the thoughts, feelings and wishes of our employees. They had comprehensive and sophisticated questions covering all relevant aspects of work. And of course there were always parts dealing with all kinds of feedback related to leadership and management.
The survey results were useful to us and they still are but they were lacking of prompt feedback. It was hard for us to see how for instance management decisions are taken or how people think about events or new strategic directions by assessing happiness half a year later. Because of the comprehensiveness of the annual surveys it was no option to simply do them more often. We wanted more direct feedback but we don’t wanted people to do surveys all day.
What we were looking for was something lightweight. Something that will take only five minutes to do and still delivers valuable content for us. We found it in the Happiness Index which was mentioned in a blog post by Jeff Sutherland and which was originally invented by Henrik Kniberg at Crisp.
The Happiness Index
If you are not familiar with the Happiness Index, let me introduce you to it. The basic idea is to ask people only few questions about their happiness but regularly and often. This will then enable you to chart happiness over time and recognize trends and impacts of events to the happiness of your team members.
The underlying believe is that happy employees are better employees in terms of creativity, productivity etc. and that one important aspect of good management is to make sure your employees are happy at work. This follows all the findings about motivation that are covered so well by Dan Pink or Simon Sinek for instance.
The Happiness Index originally asks the following questions:
- What’s your name?
- How happy are you? (on a scale from 1 “very unhappy” to 5 “very happy”)
- What makes you feel best right now?
- What makes you feel worst right now?
- What would increase your happiness?
The second question gives you a simple number as answer, which makes it very easy to aggregate and to do all kinds of fancy statistics with it. The questions three to five are free text and allow people to express their feelings about happiness in natural language.
Adopting the Happiness Index and rolling it out
The Happiness Index was originally used on a team level to visualize a team’s mood over time and to help teams and management to improve their happiness. We wanted to use it for all our IT product development teams and we already had about 25 with a total of 150 people in early 2012 when we started.
The level of trust within a team is naturally higher than the level of trust between 150 people of a whole IT department. So we decided very soon to have our Happiness Index anonymous. No name field would be part of the survey.
One other thing that we wanted to have differently than the original Happiness Index was the general happiness question “How happy are you?”. This was too general for us as we wanted to learn about things that we might be able to influence. We made two distinct questions out of it.
- How happy are you in your team?
- How happy are you with the company?
Building and maintaining good teams is one of the core management responsibilities and so the question number one was aimed to give us direct feedback about the quality of our work as team leads or ScrumMasters for certain teams.
The second question was intended to give us more insights on how people think about the bigger cultural and strategic topics in or organization. We intentionally avoided to define what “team” or “company” means. We hoped to learn where employees draw the borders here.
After some time we dropped question number four “What makes you feel worst right now?”. The given answers were highly redundant to the answers given to question five “What would increase your happiness?” and the last one seemed us to be better in enabling people to make suggestions for improvements. We find it to be more proactive.
For the amount of data we expected to collect would be too much to be visualized completely and directly we came up with the idea to have a Quarterly Happiness Review meeting with Management and all employees. For that I committed myself to dig into the collected data of the last quarter, analyse it, find trends, visualize everything and then present the results.
Running and maintaining the Happiness Index
For the high number of people we wanted to address regularly and since some of them were working remotely we looked for a web survey solution. Pretty soon we decided to go with a Google Drive survey which writes its input into a table. I spent some time figuring out how to use Google Drive functions to continuously fill in additional data into the table with every newly inserted row. But I got it working and now every survey answer got the right “next even calendar” week assigned.

The survey and the generated charts were then included into our wiki, so that our teams could use the survey and see the feedback in a happiness chart directly on one page. The chart with the aggregated team and company happiness was placed right beside the survey form and updated every couple of minutes.
Google Drive gave us this instant charting of happiness over time and allowed for some spreadsheet analysis and Excel exports to do more comprehensive analysis when needed. When I’m preparing a Quarterly Happiness Review I always end up in Excel. I play around with pivot charts to find new interesting connections in the data we have.
We decided to remind all the teams to give us happiness feedback every two weeks. I do this by simple sending out an email which contains the link to our wiki page with the embedded survey. Every two weeks is the level of granularity we found appropriate for keeping track of our employee happiness. We therefore aggregate all votes given over a period of two weeks into one data point like “calendar week 16”.
When sending reminder emails I sometimes add some ad hoc analysis. For example I give the top or low three topics of the last two weeks. This motivates people to vote as they see something is happening with the data and it is not just stored somewhere.
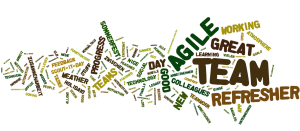
For the Quarterly Happiness Reviews I try to figure out about trends in the quantitative happiness values and show how they might relate to certain contexts in time. More important to us but more difficult to generate is the qualitative analysis. What is making people happy? What do they want to change? As those survey fields are free text by design I end up reading each end every post. To get a first impression I put all given answers in a tag cloud generator and get an intuitive visualization about the relevant happiness topics.
I then assign clusters to all the given answers. Some answers are more related to the work environment and others relate to management. Some mean something about working Agile and some speak about the teams. Over time I empirically invented a set of clusters that seems to fit the answers of our people very well. The set is precise enough for us to draw conclusions from it and still it contains not more than a couple of clusters, which makes it easy to handle.
What have we learned so far?
From Happiness Review to Happiness Review I was able to better analyse and visualize the data and learned how to interpret it. Now after two years of measuring continuously and after the sixths Quarterly Happiness Review meeting I will give you a brief summary of what we’ve learned so far about ourselves.

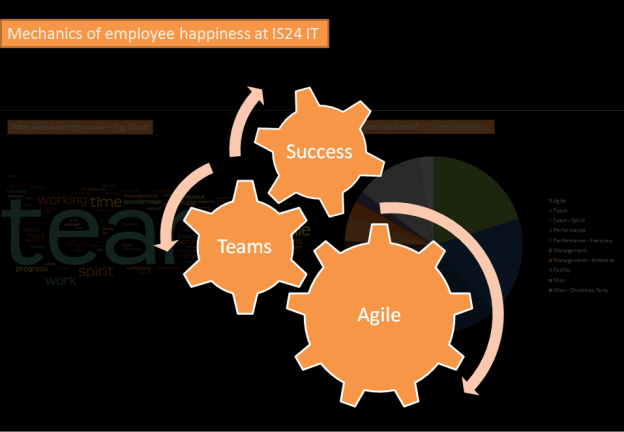
We always had the feeling to work in an open, friendly and collaborative company culture which is making us happy and it was no surprise to us that this shared gut feeling is reflected in the data too. We see that all in all our employees are very happy with and in their teams. The happiness with the company is good too, but slightly lower than the team happiness. We interpret this to be an expression of the very team focused Agile working culture that we have established in IT product development. You identify with your team first and then with the company.

From the qualitative data we’ve learned that the main sources of happiness of our IT product development teams are working in a good team, having high performance and working Agile in that order. Nearly three-quarter of all answers to the question “What makes you feel best right now?” go into on of these three clusters. Lately the cluster “Good management” is getting bigger and people give more and more positive feedback in that direction.
As one of the responsibilities of management is to keep and maintain the happiness of their teams, this learning can be seen as an empirical leadership guidance. If we want to have our IT employees happy then we must care for team building and bonding, help them perform and let them live Agile values.
On the other hand we’ve learned that certain things exist that make people unhappy too. Most of the time the change requests go into “Better management”, “Work environment” or “Be more Agile” clusters.

Since a couple of month we also have our colleges from the Sales Department on board. This enables us to recognize what happiness sources we share between IT and Sales employees and where the needs and perceptions differ between people of departments so different.
It showed up that IT and Sales share the importance of good teams and high performance for their happiness. Additionally we could see that performance is more related to reaching goals for the colleges in Sales whereas it is more related to delivering product increments for the IT teams.
In addition to that the people in the IT gain some of their happiness from reaching technical excellence which is not a surprise. The Sales teams on the other hand gain happiness from providing customer excellence as they have direct customer contact each day. Interestingly we never got any happiness feedback related to customer excellence from our IT teams though we work Agile (which the teams love) and customer happiness is an important goal for us.
This way the happiness index helps us to recognize a learning opportunity. I am convinced that we have to make Sales and IT people to talk with each other regularly about the products we build and the quality we deliver as the IT teams can only benefit from the customer excellence point of view the Sales teams have.
One last thing that I want to mention is the way the Happiness Index affected happiness directly. Like in the management wisdom “you get what you measure” just by having it set up and running and reminding people to tell us how happy they are every two weeks, our happiness became something more tangible, something that we took more serious. We had more moments to reflect and talk about it and thus treating it with special appreciation. From an employees point of view, having the Happiness Index shows that our management cares for their happiness.

If you want to try it out, here’s the link to my Happiness Index formular teamplate https://docs.google.com/forms/d/1PTGJCHp8yVg1L3mzYi524AbZ56REFltYPaJxuJdj64M/edit?usp=sharing and the corresponding data table https://docs.google.com/spreadsheet/ccc?key=0AvcMoWXUcyb5dGo0U3R3ZnRDcHdQOGt3RU4yYk91Qnc&usp=sharing
Have fun…
I can recommend http://www.smileyreport.org. It’s a simplier version of the happiness index and can be filled out every day. Including an email reminder function.
Pingback: Metrics I can believe in | Finding-Marbles
Pingback: Escalando el Índice de Felicidad | Johnny Ordóñez